GPU passthrough cost me nothing — until the GPUs had to talk to each other
A year after virtualizing my edge AI supercomputer, I finally measured what the hypervisor costs: single-GPU work is free — the VM even won — and four-way tensor-parallel serving pays a third.
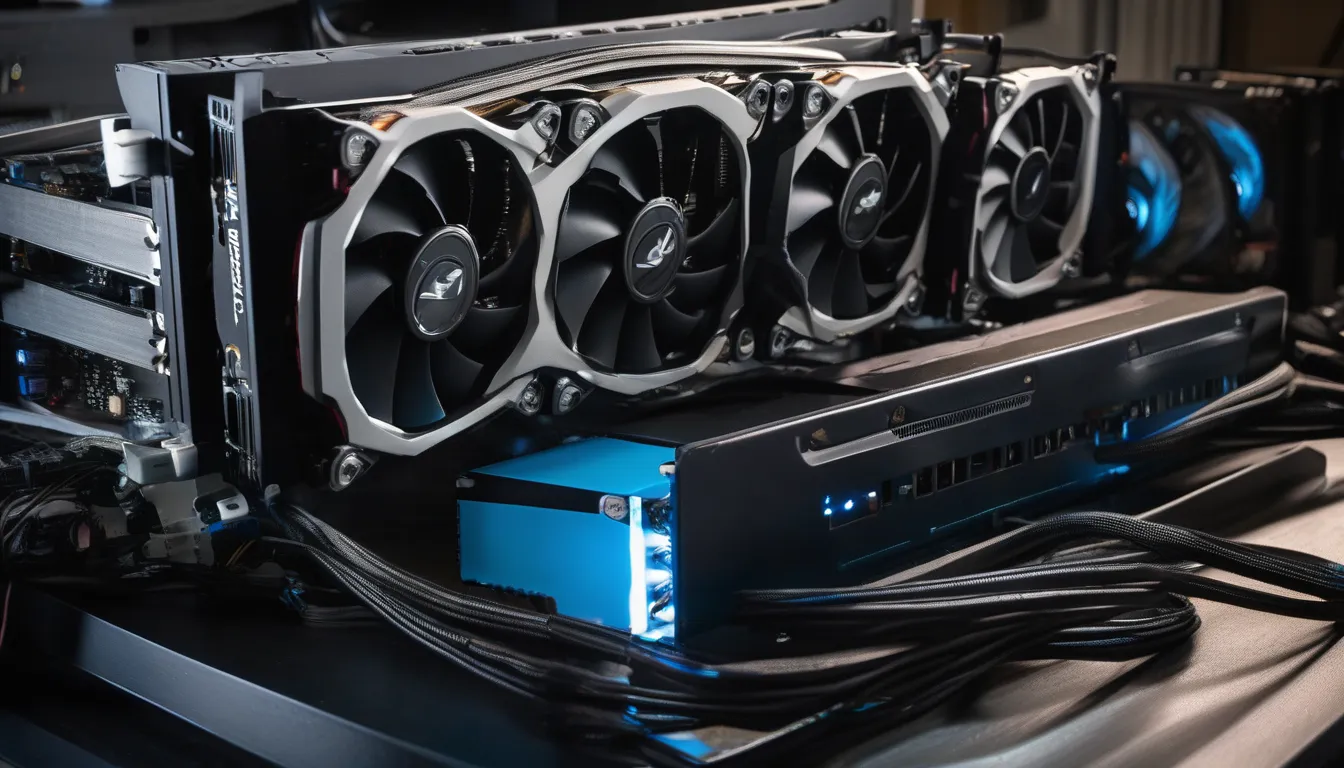
Everything you see on this blog is cooked in-house. Not stock photography, and not a cloud API — the image above was generated on one of the four RTX 3090s in the virtualized node this article measures, in about nine seconds. Full recipe below.
Feature image made in my lab — image model, prompt and settings
- Image model
stabilityai/stable-diffusion-xl-base-1.0— fp16 variant- Text encoder
CLIP ViT-L/14+OpenCLIP ViT-bigG/14— SDXL ships two, and they are a large part of why it follows a prompt as well as it does- Generated on
- 1× NVIDIA RTX 3090 (24 GB), vfio-passed through to a VM — the virtualized machine from this article, on its own hardware, offline
- Settings
- 1344×768 · 34 steps · cfg 5.0 · seed 101 · diffusers 0.40.0
- Prompt
- four identical high-end graphics cards mounted in a row on an open-frame test bench, PCIe slots and power cables visible, two matched machines side by side in a dark lab, moody editorial hardware photography, cold blue and cyan light with a single warm accent, shallow depth of field, 50mm, dark background, fine detail, cinematic, high dynamic range, no text
- Negative prompt
- text, words, letters, watermark, logo, signature, caption, ui, people, faces, hands, cartoon, illustration, cgi render, oversaturated, blurry, low quality, jpeg artifacts
- Licence
- CreativeML Open RAIL++-M — the SDXL 1.0 base licence. Commercial use permitted, with use-based restrictions; read it before you ship something with it
More AI-generated images? My reference project OpenChef does this at scale — every recipe photo carries every version of itself, with the full prompt, model, encoder, seed and licence.
Almost exactly a year ago, I added a virtualization layer to my edge AI supercomputer — Proxmox VE with GPU passthrough, all cards handed to a VM — and at the end of that article I made a promise: one day I would properly measure what this layer actually costs.
In this blog post, I finally keep that promise. I built two identical four-GPU machines — one bare metal, one virtualized — and raced them against each other for a whole weekend. I will show you exactly what I measured, what broke, where my own benchmark lied to me, and the simple rule I ended up with.
Here is the number I went looking for: what does a hypervisor cost an AI workload?
Here is the number I found: nothing. And also a third.
Both are true. Which one you get depends on something I had not thought about at all before this weekend, and which I have not seen written down anywhere: virtualization does not tax compute. It taxes coordination.
Finding that out took a weekend and roughly 37 kilowatt-hours — two machines pulling 1–2 kW between them whenever a sweep was running, for two days. One machine died in the middle of it. One benchmark lied to me for three hours. Let’s go through what actually happened.
The setup: a fair fight needs two identical machines
You cannot answer this question with one machine, and you cannot answer it with two machines that differ. So I built a matched pair.
Two workstations, same board family, same CPU, same class of memory, same NVMe. Four RTX 3090s in each. One runs Ubuntu on the bare metal. The other runs Proxmox, with all four cards handed to a single Linux guest by vfio passthrough — the guest owns the GPUs completely; the host cannot even draw a console on them. This is the same setup I built in last year’s article, just grown up a bit.
Then came the boring part, and the boring part is the whole game: identical, identical, identical. Same vLLM build (down to the same git commit), same NVIDIA driver, same CUDA, same PyTorch, same model, same serving flags, same tensor-parallel size. I capped all eight GPUs to 350 W, because two of the cards in the virtualized box shipped with a 370 W stock limit and I was not going to hand it a 40 W-per-card advantage.
The load generator runs on each machine. Not across the network. If the network is in the measurement, you are benchmarking the network.
Then I ran the same work on both, three times each, and took the median. Boring? Sure. Necessary? Absolutely.
Round one: the VM loses by 20 %, and the numbers make no sense
First real sweep. Serving a 32-billion-parameter model, four-way tensor parallel, the way you would actually run it. The virtualized box came in 20 % behind at low concurrency, and worse as I pushed it.
Fine. That is roughly what the internet expects. Virtualization costs something. Case closed, short article.
Except I had also run the microbenchmarks, and they said the exact opposite.
Host-to-device PCIe bandwidth: identical. Within 0.2 %. The IOMMU — the thing everyone warns you about, the address-translation layer that sits between a passed-through device and host memory — cost nothing on the inbound path.
GPU-to-GPU copies: identical. Within 1.6 %.
Raw fp16 matrix multiply: the VM was 4.5 % faster. Not a rounding error, and not magic — the cards in that box carry slightly higher boost tables. But the point stands: the silicon was not being slowed down. If anything, it was having a better day than the bare-metal box.
Single-thread CPU: 0.8 % apart. Eight threads: 0.6 % apart.
So every component was free, and the whole was 20 % slower. That is not a result — that is a contradiction, and a contradiction means you have not found the variable yet. I love a clean measurement. This was not one. Back to work.
Then one machine simply vanished
I switched to a heavier workload — long prompts, the shape a coding assistant actually produces — and eleven minutes in, the virtualized box vanished. Not crashed. Vanished. Host and guest at the same instant, off the network, no response on any port.
No panic. Let’s do forensics.
The forensics were unusually clean, in the sense that there was nothing there. No kernel panic.
No out-of-memory. No machine-check exception. No PCIe error. No thermal event. No shutdown
sequence. The system log simply stops mid-sentence, on a routine timer message, and last
records the boot as crash.
A software failure always leaves a fingerprint. This left none — which is itself the fingerprint. The machine lost power.
The telemetry from the final six minutes told the rest: memory 34 GiB free and flat, load moderate, GPU temperatures a perfectly normal 78–82 °C, and four GPUs pulling a sustained 1002 → 1119 watts between them. Add the CPU and the board and that box was asking for roughly 1.4 kW continuously.
It was running on two 1000 W supplies, split so that one carried the motherboard plus two cards, and the other carried two cards alone. The one feeding the two cards alone was the one that, when I got to it, was noticeably hot to the touch.
Two RTX 3090s pull about 540 W between them at a 350 W cap. That is comfortably inside a 1000 W unit — until you remember that these cards are notorious for microsecond transients approaching twice their rated draw. Two of them spiking together can momentarily ask for well over a kilowatt. A heat-soaked supply hits its protection circuit and drops the rail, and everything above it disappears in the same instant.
The other machine — same four-GPU load, same cap, same minute — did not flinch. It runs two 1200 W supplies.
And let me be very clear about this, because it matters: this is not a virtualization finding. It would be easy to write “the VM crashed under load” and be completely wrong. Nothing in the failure chain involves the hypervisor, the IOMMU, or the guest. It is a power-supply sizing mistake, my mistake, and it would have happened identically on bare metal. I have built enough machines to know better — and apparently I needed the reminder anyway.
I replaced both supplies with 1200 W units and re-ran the entire study. The box has since sustained 1157 W peaks — above the band that killed it — with zero events.
The lesson is one sentence: nameplate is not headroom. 2000 W across two supplies is not 2000 W of usable capacity when one of them is carrying two transient-heavy cards by itself.
The benchmark that lied to me for three hours
While the box was down, I re-examined the numbers, and found something worse than a dead machine: a measurement that was quietly wrong.
I ran the same sweep twice, back to back, changing nothing.
| first run | immediate repeat | |
|---|---|---|
| throughput, 32 concurrent | 262 tok/s | 513 tok/s |
| time to first token | 1017 ms | 66 ms |
Twice as fast, for free, on the second pass. OMG.
That is prefix caching. vLLM turns it on by default, which is correct for production and fatal for a benchmark: I was generating the benchmark prompts from a fixed random seed, so every run produced identical prompts, so every run after the first read its prefill straight out of the KV cache. I was benchmarking a cache and calling it a hypervisor.
There was a second one hiding next to it. sysbench’s memory test defaults to a 1 KiB block
size, which measures loop and syscall overhead far more than it measures memory bandwidth. It
told me the VM had lost 46 % of its memory bandwidth. With a 1 MiB block — an actual bandwidth
test — the real figure is 32 %.
Both of these produced plausible numbers. That is what makes them dangerous. A benchmark that returns something obviously insane gets caught in ten minutes; a benchmark that returns something believable gets published.
So I threw out everything, disabled prefix caching, and re-ran every measurement three times. Kudos to vLLM’s own startup log here — it prints the effective flags, so I could verify the cache was really off instead of trusting my command line. Trust, but grep.
The control experiment: give the GPUs a job where they never talk
Back to the contradiction. Every component was free, the whole was slow. So I asked a different question: what happens if the GPUs never have to talk to each other?
Image generation. Stable Diffusion XL, 1024×1024, 30 steps, fixed seed, one GPU. No tensor parallelism. No collective communication. Just a long series of GPU kernels with almost nothing for the host to do between them.
| seconds per image | steps/s | |
|---|---|---|
| bare metal | 8.166 | 3.674 |
| virtualized | 7.990 | 3.755 |
The VM won. 🎉
By 2.2 %, with distributions that do not overlap — the slowest virtualized run was faster than the fastest bare-metal one. I did not expect that, and I re-checked it before I believed it.
There it is. Take the host out of the loop, and the hypervisor tax is not small — it is negative.
So what is the multi-GPU case doing differently?
When you run a model tensor-parallel across four cards, every layer ends in an all-reduce — the four GPUs must combine their partial results before anything can proceed. On a machine with NVLink, they do that directly. On a machine without it — four consumer cards in PCIe slots — that traffic is staged through host memory.
And host memory is the one thing in this system that virtualization measurably slows down.
Add the per-token work the host does anyway — scheduling, sampling, detokenizing — and you have a workload that touches the host thousands of times a second, on a machine where every host touch is slightly more expensive.
That is the whole finding. The GPUs did not mind being virtualized. The conversation between them did.
Four attempts to tune it away — none of them worked
My rule in this lab has always been: there’s always a solution. This weekend I found the exception. A result you cannot break is worth more than a result you like, so I tried hard to break this one.
The obvious suspect was CPU. The guest had been given 12 of the host’s 32 threads — a deliberate split, to leave room for other VMs. Maybe I had simply starved it.
I gave it all 32 threads. Nothing changed. That eliminated the entire “you under-provisioned it” explanation in one move, which is the most useful thing a negative result can do.
Next suspect: NUMA. The host is a two-die CPU with two memory nodes; the guest was seeing one flat node, so it could not place threads near their memory. I exposed a matching two-node topology.
It got worse. Which turned out to be its own small lesson: a topology the guest cannot trust is worse than no topology at all, because the guest starts optimising against a map that does not correspond to where the memory physically is. Pinning each guest node to a real host node repaired the damage — and got me back to exactly where I started.
Marking the virtual disks as solid-state rather than rotational recovered part of the sequential read gap. It did nothing for serving.
Four configurations. The spread between the best and worst was smaller than the gap I was trying to close.
At that point it stops being a misconfiguration and starts being a property of the machine. Accepting that is also a result.
The answer: one question decides it
| workload | what it asks of the host | result |
|---|---|---|
| Image generation, 1 GPU | almost nothing | VM is 2.2 % faster |
| Raw PCIe, peer copies, matmul | nothing | free (matmul favours the VM) |
| Per-core CPU | nothing | free (0.8 %) |
| LLM serving, 4-way tensor parallel | an all-reduce per layer, via host memory | 22–36 % slower |
And the penalty grows with concurrency — 23 % with one request in flight, 31 % at eight, 36 % at thirty-two. More concurrent work means more host involvement per token, which means more tax. Any benchmark that measures a single stream will understate what a real serving node loses.
So if you are deciding whether to virtualize GPUs, the question is not “how much does a hypervisor cost”. It is:
Does my workload need the GPUs to talk to each other through the host?
If no — one model per card, image and video generation, embeddings, rerankers, vision models — virtualize it. You lose nothing, you gain snapshots, migration, isolation, and the ability to run other things on the same box.
If yes — one large model split across every card in the machine — keep it on bare metal, or accept that you are paying about a third of the machine for the convenience.
I find that a much more useful rule than a single percentage, and it is not the rule I expected to end up with. That is exactly why measuring beats believing.
Below the line: the numbers, the method, and what I did not test
I love building documentation — but only nice and useful ones. So here is everything, in case you want to repeat this or argue with it. Both are welcome.
Serving throughput, four configurations
32B model, four-way tensor parallel, prefix caching off, median of three runs. Output tokens per second, and the delta is the virtualized machine against bare metal.
| concurrency | as deployed (12 vCPU) | full 32 vCPU | 2-node NUMA, unpinned | NUMA pinned + SSD flag |
|---|---|---|---|---|
| 1 | −23.2 % | −22.1 % | −24.8 % | −22.8 % |
| 8 | −31.2 % | −30.3 % | −35.0 % | −31.2 % |
| 32 | −34.0 % | −35.3 % | −36.7 % | −35.7 % |
A coding-shaped workload (4096-token prompts, 512-token answers) landed slightly better — −20.5 / −28.6 / −30.5 % — which fits: longer prefill means more of the wall-clock is pure GPU work, and pure GPU work is free.
Latency was consistently worse than throughput: time-to-first-token +49 to +66 %, 99th-percentile inter-token latency +49 to +70 %.
The component tests
| bare metal | virtualized | delta | |
|---|---|---|---|
| Host→device PCIe (x16 / x8 slots) | 13.22 / 6.68 GB/s | 13.22 / 6.69 GB/s | ±0.2 % |
| GPU→GPU copy | 4.16 / 3.22 GB/s | 4.22 / 3.18 GB/s | ±1.6 % |
| fp16 matmul, 8192³ | 66.9–68.4 TFLOPS | 69.4–71.6 TFLOPS | +4.5 % |
| CPU, 1 thread / 8 threads | 2092 / 15950 ev/s | 2076 / 15848 ev/s | −0.8 / −0.6 % |
| Memory bandwidth, 8 threads, 1 MiB blocks | 23.9–24.2 GB/s | 15.2–16.5 GB/s | −32 to −36 % |
| Model load from disk, 62 GB of weights | 35.7–38.3 s | 78.5–83.4 s | +114 to +130 % |
That last row is the most reproducible result in the whole study — four measurements across two different 62 GB models, every one between +114 % and +130 %. The guest’s storage is a virtual disk on a copy-on-write pool; sequential reads run 35–44 % slower, and loading a large model is nothing but a long sequential read. If you reload models often, that is the number that will irritate you daily, long before you notice the serving delta.
The thermal footnote that cuts against my own result
Two-second telemetry ran on both machines throughout. Kudos to that telemetry — it caught something I was not even looking for: on the bare-metal box, one of the four GPUs sits at 86–90 °C and clocks roughly 300 MHz below its siblings, at lower power draw — the signature of a card that has hit its thermal limit and backed off.
That handicaps the bare-metal side. Which means every virtualization deficit above is, if anything, understated. It is also a cooling job I now have to do. The to-do list never shrinks in this lab; it only rotates.
One more observation from the same telemetry: under load the virtualized machine drew more power at higher GPU utilisation while producing less output. GPUs spinning on a collective that has not arrived yet still burn watts. The energy cost per token is worse than the throughput number alone suggests.
What I did not test, and what would change my mind
- The single most likely way this whole result evaporates: I run these GPUs with peer-to-peer transfers disabled, a workaround I inherited from an unrelated hang on a different machine months ago. That setting is precisely what forces the all-reduce through host memory. If peer-to-peer works fine on this hardware, the mechanism I have just spent two days characterising may be an artifact of a workaround I did not need. Testing that is cheap, and it is the first thing I will do.
- Two-way tensor parallel. If the penalty scales with the number of participants in the collective, two cards should cost about half of what four cost. That would confirm the mechanism outright. Both models I had cached need four cards to fit, so this needs a smaller model first.
- A long soak. I have no multi-day stability data. Passthrough stability over time is unknown here, not “good”.
- A different storage backing. Copy-on-write is the obvious remaining suspect for the sequential-read gap.
What’s next — and this time, you decide
Every article in this series ends with a promise about the next one. This time I am doing it differently: my writing queue is public, and readers vote on it.
The follow-ups above — the peer-to-peer re-test, the two-card scaling experiment, the long soak — are exactly the kind of thing I put on the queue. Every item there is already researched or half-built; the votes decide what I write up next. If you want the peer-to-peer answer before I get distracted by the next shiny problem, go vote for it. It takes one click and a LinkedIn sign-in, and it genuinely reorders my week.
If you have run this comparison yourself and got something different — especially with peer-to-peer enabled, or on hardware with NVLink — I would love to hear about it. The interesting part of this result is the mechanism, not the percentage, and mechanisms are worth arguing about.
That’s it for today. Two machines, one weekend, 37 kWh, one dead power supply, one lying benchmark — and one rule I will actually use. Fair deal. :)